Developing an Index of Biological Integrity
|
|
||
| United States Environmental Protection Agency |
Office of Water Office of Wetlands, Oceans and Watersheds (4502-F) |
EPA843-F-98-001e July 1998 |
|
|
||
Wetland Bioassessment Fact Sheet 5
One method to assess biological integrity of wetlands is to develop an index of biological integrity (IBI) for an assemblage of wetland plants or animals. An IBI is made by combining several biological indicators, called metrics, into a summary index. A well-constructed IBI that can allow scientists to: (1) measure condition, (2) diagnose the type of stressors damaging a wetland's biota, (3) define management approaches to protect and restore biological condition, and (4) evaluate performance of protection and restoration activities.
Four Steps to Create an IBI
| 1 Select an Assemblage |
2 Test and Evaluate Metrics |
3 Combine Metrics into an IBI |
4 Test and Validate IBI |
|---|
1. Select an Assemblage
An assemblage is a group of plant and animals that are combined to form a larger group. Common wetland assemblages include:
- Vascular plants
- Amphibians
- Birds
- Algae
- Macroinvertebrates (snails, insects, clams, crayfish, etc.)
A metric is a measurable component of a biological system with an empirical change in value along a gradient of human disturbance
2. Test and Evaluate Metrics
A metric is a measurable component of a biological system with an empirical change in value along a gradient of human disturbance Scientists can measure many biological attributes of wetlands such as the diversity of amphibians or the number of pollution-tolerant insects. Some of these attributes will provide valuable information about biological integrity and other attributes will not. The goal is to identify metrics, which are attributes that show an empirical and predictable change in value along a gradient of human disturbance. The gradient of human disturbance can represent the amount of logging, agriculture, development, impervious surfaces, or other land use or activity in a watershed, or some combination of land use, depending on the purpose of the bioassessment. An example of a metric is taxa richness of macroinvertebrates (the number of taxa of insects, snails, clams, crayfish, etc.). Several states have found that macroinvertebrate richness decreases as a wetland is degraded by human activities.
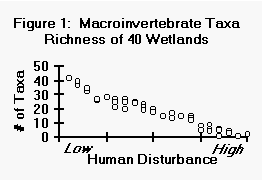
(Figure 1). For illustrative purposes, Figures 1-5 were developed using hypothetical data, but are based on figures that were provided by Dr. James Karr (University of Washington). As Figure 1 shows, there is a clear response to increasing human disturbance and this attribute could be used as a metric.
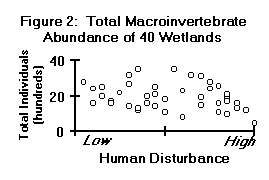
In contrast, total abundance of macroinvertebrates is often more dependent on natural environmental variability of wetlands and does not show a reliable change in response to human disturbance (Figure 2). As Figure 2 shows, there is no clear response to increasing human disturbance and this attribute would not be useful as a metric. In these two examples, total taxa richness of macroinvertebrates could serve as a metric and total abundance could not.
3 Combine Metrics into an IBI
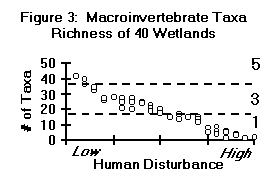
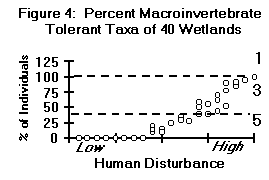
Typically, an IBI is formed by combining at least 7 metrics from one biological assemblage. One approach of combining metrics into an IBI is to assign scores of 1, 3, or 5 to the metrics according to how they respond to human disturbances. For example, the diversity and richness of macroinvertebrate taxa may consistently decrease with increasing human disturbance (Figure 3). In this case, we could assign a score 1 to indicate poor conditions, 3 to indicate moderate conditions, and 5 to indicate minimally impacted conditions (Figure 3). Another metric, the relative abundance of tolerant taxa [(number of tolerant individuals in sample) / (total number of individuals in sample) x 100], may increase with increasing human disturbance (Figure 4). In this case, a wetland dominated by tolerant taxa would receive a low score and a wetland with a small percentage of tolerant taxa would receive a high score .
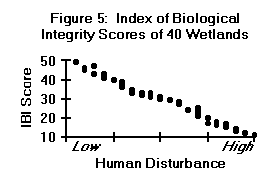
If 10 metrics were scored in this manner, then the scores could be added together to form the index of biological integrity (IBI) with potential scores ranging from 10 (maximally impacted) to 50 (minimally impacted). The IBI scores should form a relatively straight line when plotted against the gradient of human disturbance (Figure 5). Sometimes there will be scores that are far from the line which should be investigated. More often than not, an outlier is either the result of (1) misclassifying the wetland or (2) a stressor, such as acid mine drainage, that is damaging the wetland biota and was not captured by the gradient of human disturbance.
4 Test and Validate IBI
After developing the IBI, the scientists would then test the IBI to see if it accurately detects the effects of human disturbances on the biological assemblage. One approach is to (1) randomly split the data into two halves, (2) develop the IBI on one half of the data, and (3) test the IBI on the other half of the data. The results should be similar. Scientists can also test the IBI on more than one gradient of human disturbance. For example, the scientists may first develop the IBI with a gradient such as the percent of a watershed that is logged. During subsequent years, they could test the same IBI across another gradient of human disturbance, such as percent of watershed with impervious surfaces or distance of wetlands to nearest road or farm field. Some metrics will consistently show clear patterns regardless of the type of human disturbance used on the X axis.
After testing and validating the index, they could directly measure the health of similar wetlands without having to measure every attribute. They would only have to measure the ten metrics and some basic chemical and physical characteristics of the wetlands to help diagnose the type of stressor(s) damaging wetlands and to develop plans to reduce the impacts. When reporting results of a bioassessment, the IBI score should always be accompanied by a narrative description of the overall site condition, scores of the individual metrics, and a narrative descriptions of each metric as compared to conditions found in reference wetlands of the same type and region.